FinTech Dashboard
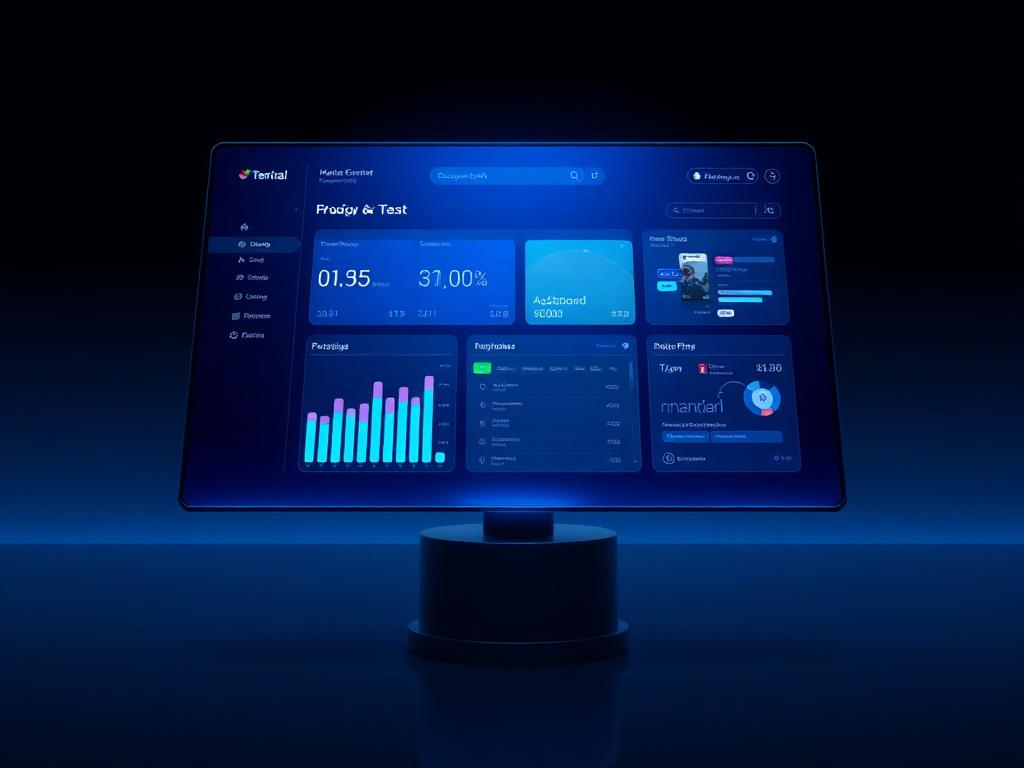
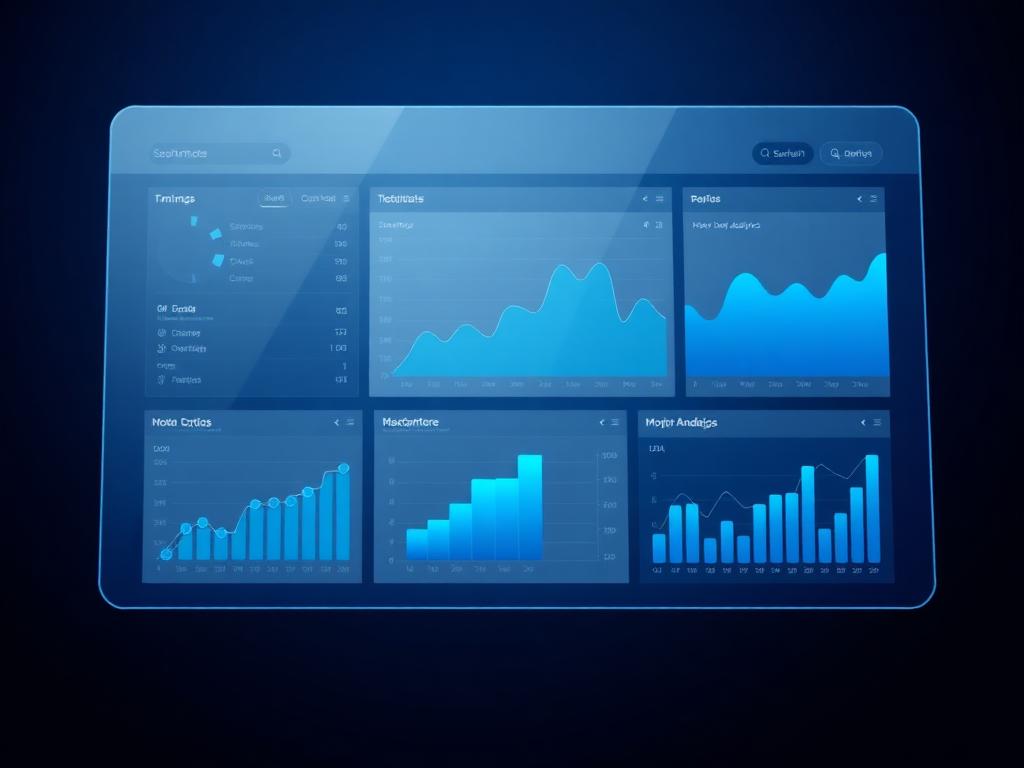
A dense analytics dashboard made readable through clear hierarchy and live data views.
- Client
- Payments platform
- Industry
- Financial Services
- Timeline
- 16 weeks
-71%
Time to insight
+90%
Daily active analysts
250 ms
Median query render
-65%
Spreadsheet exports
The Challenge
Analysts exported data to spreadsheets because the product's own dashboard was too slow and too cluttered to trust for daily decisions.
Our Solution
We redesigned the information hierarchy around the five decisions analysts make every morning, then rebuilt the front end in TypeScript and React with virtualised tables and streaming updates.
How We Worked
- 01
Decision-led IA
Interviewed analysts to rank the metrics that drive action, and demoted everything else into drill-downs.
- 02
Performance budget
Set strict render budgets, virtualised large tables and moved heavy aggregation server-side.
- 03
Systemised the UI
Delivered a documented component library with charts, tables and states so future modules stay consistent.
What We Delivered
- Live transaction and settlement monitoring
- Virtualised tables handling millions of rows
- Configurable dashboards per role
- Anomaly and threshold alerting
- Accessible dark and light themes
Services & Stack
- UI/UX Design
- Web Development
- Design Systems
- TypeScript
- React
- Design System
“It is the rare redesign where the team stopped asking for exports because the product was simply faster.”
The Outcome
The dashboard replaced the morning spreadsheet ritual entirely and is now the platform's most used internal surface.
Start a Similar Project